Using NDepend to Analyze Your Code
Recently I got my hands on the full version of NDepend and I decided to take advantage of that by trying it out on a couple of projects I am working on, both personally and professionally. It turned out that NDepend isn't all that easy to use if you want to make the most out of it. In this post I'll go over the steps I made to set everything up and reconfigure it in a way that made the results more meaningful to me.
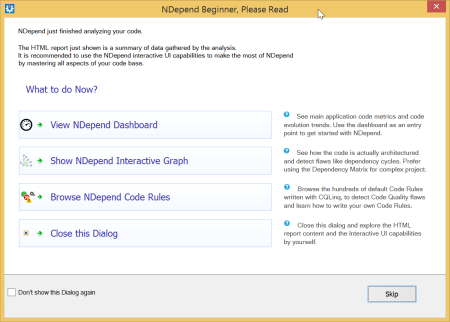
It starts out really easy. Once you have the add-in installed, you just need to attach a new NDepend project to the solution that you have already opened in Visual Studio. After the initial analysis is completed, an HTML report is generated and opened in your browser, while a popup suggests a couple of next steps for you.


Since I'm a great proponent of unit testing, it immediately stood out to me that I have a missing application metric: no info about the test code coverage.
NDepend relies on results from other code coverage tools to calculate this metric. If you have Premium or Ultimate edition of Visual Studio, you can use the results of its code coverage analysis, otherwise you can choose between two alternatives: NCover and JetBrains DotCover. Neither of them is free, but they both have a trial available that you can evaluate. I used Visual Studio and the process is really simple:
- First, Analyze Code Coverage on All Tests from the Test menu.
- Then open Code Coverage Results Window from the Test > Windows menu. The first icon in its toolbar allows the export of results into an XML based file which can be consumed by NDepend.
- Open NDepend project properties on Analysis page and open Code Coverage Settings from the bottom of that page. Here you can add the exported file to the list. Don't forget to save changes.
Now the Dashboard should refresh and show the code coverage metric value based on the data in the imported file.
The next logical step would be fixing the code rules violations, starting with the critical ones. NDepend namely includes approximately 200 code rules which analyze your code and issue warnings about its quality. As soon as your code base grows in size it is bound to violate at least some of the rules in the default set. Based on your own judgment and the requirements of the project, you can decide how you will address them:
- Preferably you fix the code so that the rules are not violated any more.
- You can decide to disable specific rules on the NDepend project level, i.e. on the Visual Studio solution level in my case. The default set of rules mostly does encourage good development practices therefore some thought should be given to each one of them, before deciding to actually disable it.
Instead of simply disabling the rule when it doesn't fully match your situation, it might make sense to modify it a bit instead of completely disabling it. This works best when you want to ignore some violations but still keep the check for the rest of the code. Minor modification of the rules are actually quite easy if you know LINQ, since all of the rules are just LINQ queries, or to be more precise CQLinq queries, allowing you to query the results of NDepend's static code analysis.
For example, I decided to modify the Potentially dead Methods query to make it ignore methods from specific auto generated classes. Double clicking the rule in the Queries and Rules Explorer brings you to the Queries and Rules Edit window which contains the query used by the rule. To modify the rule as required I just had to add an additional condition to the end of the canMethodBeConsideredAsDeadProc range variable existing checks:
let canMethodBeConsideredAsDeadProc = new Func<IMethod, bool>(m =>
    !m.IsPubliclyVisible &&
    !m.IsEntryPoint &&
    !m.IsExplicitInterfaceImpl &&
    !m.IsClassConstructor &&
    !m.IsFinalizer &&
    !m.IsVirtual &&
    !(m.IsConstructor &&
      m.IsProtected) &&
    !m.IsEventAdder &&
    !m.IsEventRemover &&
    !m.IsGeneratedByCompiler &&
    !m.ParentType.IsDelegate &&

    !m.HasAttribute(
        "System.Runtime.Serialization.OnSerializingAttribute".AllowNoMatch()) &&
    !m.HasAttribute(
        "System.Runtime.Serialization.OnDeserializedAttribute".AllowNoMatch()) &&

    !m.HasAttribute("NDepend.Attributes.IsNotDeadCodeAttribute".AllowNoMatch()) &&

    !m.ParentType.FullName.StartsWith("My.Namespace.For.Generated.Classes."))
Although the editor provides IntelliSense and runs the query continuously showing you the results or the query compilation errors if there are any, it still is quite challenging to come up with rules of your own or even to significantly change the existing rules; mainly because there is no debugging available and only a small set of types can be output as a result to see the actual values being manipulated. Of course any changing or writing of the rules requires a project with representative data to be able to test them at all.
Nevertheless, I think the tool can be very useful when working with a large code base, and even more so when there are many developers working on it, requiring additional checks to be performed on every build to ensure that none of the agreed upon conventions are being violated. A large set of default rules are a nice bonus, making the tool easier to start with. Based on the experience so far, I'm still not really sure how difficult it would be to write a new custom rule from scratch and what are the limits for such checks. It would be interesting to compare its capabilities in this field to the Roslyn CTP that was released last year. This might be an interesting topic for another blog post.
