Debugging Ionic 2 Apps in Chrome from Visual Studio Code
Ionic 2 is the successor to the quite popular hybrid mobile framework. It is based upon Angular 2, but unlike it, it hasn't yet reached the final release; the latest version is Release Candidate 3. This makes it still a bit rough around the edges and lacking in documentation. Debugging with source maps is one of the features, which still pose a challenge to set up for many developers.
I couldn't find any guidance in the documentation, but fortunately there was information elsewhere, which helped me get it working.
I started out with a new Ionic 2 project using the tutorial template:
ionic start ionicSample tutorial --v2
There's only one modification required to the project files. Just add the following lines to package.json:
"config": {
  "ionic_source_map": "source-map"
},
Too bad, it's not there by default. It would have spared me some time.
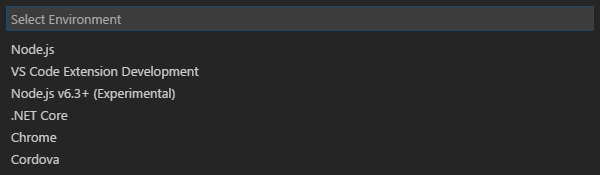
Since I'm using Visual Studio Code as my editor of choice for Ionic 2 development, I wanted to use it for debugging as well. I don't want to switch to a browser for that if I don't need to. The only prerequisite is the Debugger for Chrome extension. And Chrome, of course. To configure it, just press F5 with the Ionic project folder as current workspace and select Chrome as target environment.
This will create a new .vscode/launch.json configuration file. You only need to modify the webRoot value of the launch configuration to point to the www folder and change the port in url value to 8100. Feel free to rename the configuration to your liking. I also removed the attach configuration since I don't plan on using it. These are the final contents of my launch.json file:
{
  "version": "0.2.0",
  "configurations": [
    {
      "name": "Launch in Chrome",
      "type": "chrome",
      "request": "launch",
      "url": "http://localhost:8100",
      "sourceMaps": true,
      "webRoot": "${workspaceRoot}/www"
    }
  ]
}
To test that everything is set up correctly, you will first need to run the Ionic serve command. In Visual Studio Code you can choose between the following two approaches:
- Open the integrated Terminal window with
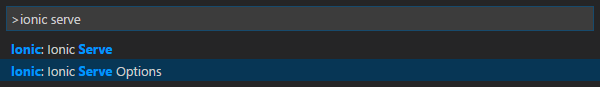
Ctrl+`and typeionic serve -b(the-bswitch will prevent the page from opening in your default browser). To stop the server, pressCtrl+Cin the terminal window. - Install the ionic 2 Commands with Snippets extension and invoke the
Ionic Serve Optionscommand from the Command palette using theWith out Browseroption. To stop the server, invoke theKill running Ionic Processcommand and select the right process.
I haven't yet decided, which option I'm going to be using.
Now you can press F5 to open the application in Chrome and attach a debugger to it. You shouldn't have any other instances of Chrome running when you do that or the debugger will fail to attach to it. This is a known Chrome limitation and you can read more about it in the Troubleshooting section of the extension documentation. Since Chrome is not my default browser, this wasn't an issue for me.
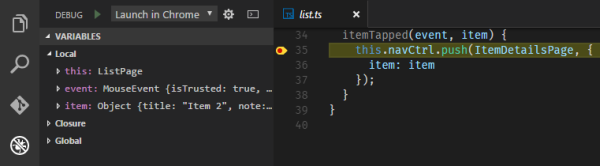
Before continuing, set a breakpoint in line 35 of src/pages/list/list.ts. Then navigate to My First Page in the sample application and click on any item. With everything configured correctly, the execution should stop at your breakpoint.
Once you're done with debugging, stop the debugging session by pressing Shift+F5. This will kill the Chrome instance as well. You can continue using the app, though, as the Ionic server is still running. Don't forget to stop it when you don't need it any more, as described above in the launching procedure of your choosing.
