Debugging a Capacitor Ionic application
Ionic documentation is increasingly recommending Capacitor over Cordova as the native runtime environment for running the applications on mobile devices. While the different approach to handling native source code in Capacitor has its advantages, the debugging experience for the TypeScript part of the applications leaves a lot to be desired.
For Cordova apps, Visual Studio Code users can install the Cordova Tools Extension and debug the Ionic application running on an Android device directly inside the text editor with minimum configuration effort:
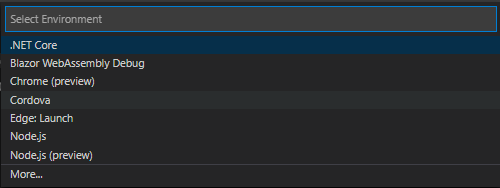
In the Run pane click on the create a launch.json file link and select Cordova from the list of choices.
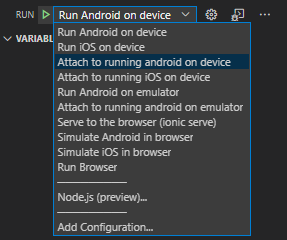
This will add a long list of launch configurations for Cordova apps. When the application is running, select Attach to running android on device or Attach to running android on emulator to attach the debugger to it. From here on, you can set breakpoints, inspect variables, and do everything else that the Visual Studio Code debugger supports.
As expected, these configurations don't work with Capacitor applications. Unfortunately, there's currently no Visual Studio Code extension with such functionality for Capacitor. Which leaves Chrome and Edge DevTools as the only available options for debugging. Since they are both based on Chromium, they offer a very similar experience and the choice is a matter of personal preference.
To attach the debugger to a running application, follow these steps:
Navigate to
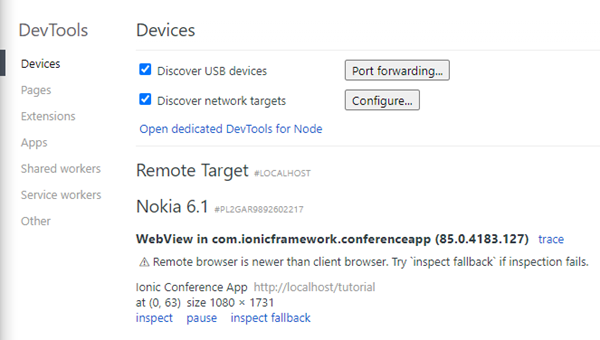
chrome://inspectin Chrome (oredge://inspectin Edge)Wait for device discovery to complete and click on the inspect link under the entry corresponding to the device and the application you want to debug.
On the Sources tab, you can navigate the sources and set breakpoints to break the application execution. Unfortunately, source maps for (Angular-based) Ionic applications don't work, so you're stuck with transpiled and bundled JavaScript code which makes the debugging experience much worse.
However, there is a fix for that. All credit for the following instructions goes to Even Monfee. I'm including them here for convenience:
Create a file named
attach-source-maps.jswith the following contents in the root of your project folder:let fs = require("fs"); let path = require("path"); const TARGET_DIR = "www"; module.exports = function (ctx) { console.warn("====================="); console.warn("WARNING: Sourcemaps have been manually added."); console.warn("Ensure this is disabled in production!"); console.warn("====================="); let files = fs.readdirSync(TARGET_DIR); files.forEach((file) => { let mapFile = path.join(TARGET_DIR, file + ".map"); let targetFile = path.join(TARGET_DIR, file); if ( (path.extname(file) === ".js" && fs.existsSync(mapFile)) || (path.extname(file) === ".css" && fs.existsSync(mapFile)) ) { let bufMap = fs.readFileSync(mapFile).toString("base64"); let bufFile = fs.readFileSync(targetFile, "utf8"); let result = bufFile.replace( "sourceMappingURL=" + file + ".map", "sourceMappingURL=data:application/json;charset=utf-8;base64," + bufMap ); fs.writeFileSync(targetFile, result); } }); };Modify the
ionic.config.jsonfile to include the following:{ "hooks": { "build:after": "./attach-source-maps.js" } }
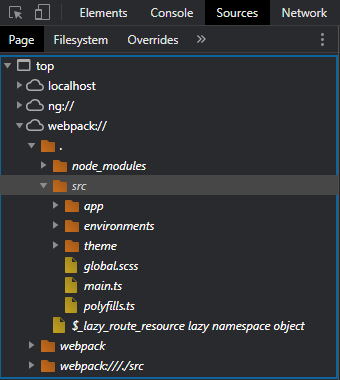
With these changes, the mapped source code of the application will be available in the webpack://./src folder on the Sources tab:
Keep in mind that the source code is now included in the bundle and therefore significantly increases its size. Make sure you're not doing this for your production builds, either by adding a check to the script above or by removing the hook from ionic.config.json before starting the build.
If you want to test the debugging experience yourself, you can use the code from my GitHub repository. I created two Ionic applications based on the conference starter template: one with Cordova and one with Capacitor. I added the source map fix from above to both of them.
Unfortunately, you can't debug Capacitor Ionic apps directly from Visual Studio Code yet, like you can Cordova Ionic apps. You will need to use Chrome or Edge DevTools instead. To make the source maps work with them, you can use a build hook which includes the source code in the final application bundle.
