Debugging Karma Tests in a Browser
Having unit tests usually drastically reduces the need for interactive debugging. However, being able to debug unit tests can sometimes prove very useful. Some IDEs provide integrated debugging experience, and I have already written about that in the past here, here, and here.
But even if your editor of choice doesn't have such a feature, you can still take advantage of your browser's built-in debugger. Nowadays, any browser includes a fully featured debugger as part of its developer tools. On the other hand, Karma test runner has a dedicated feature for in-browser debugging. Since I couldn't find much information on how exactly to use this feature, I wrote short instructions for a project I am working on. I decided to make a blog post out of it, so that others can benefit from it as well.
To make running unit tests as hassle-free as possible, I started with a NPM script for continuously running the tests:
{
  "scripts": {
    "test-watch": "node node_modules/karma/bin/karma start --browsers=Chrome --single-run=false --auto-watch"
  }
}
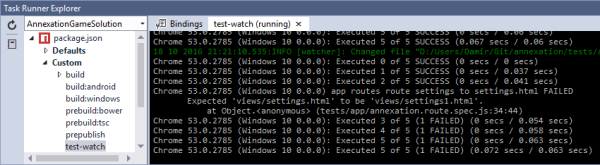
This way, one only needs to start the runner once, and it will continuously run the tests whenever it detects a change in one of the files, notifying the developer, when a test fails:
npm run test-watch
You might even be able to run the NPM script directly inside your IDE, to have this information immediately visible. In Visual Studio you will need to install NPM Task Runner extension to do that. It will allow you to simply double-click the NPM script in the Task Runner Explorer window:
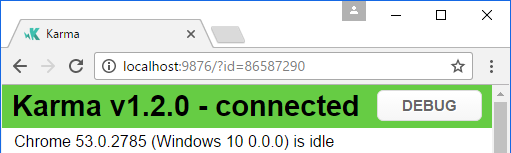
While the test runner is active, it will keep a Chrome tab open, inside which the tests will be run. Although you could open a debugger directly in this tab, you don't want to, as it will interfere with the test runner, making debugging more difficult than it needs to be. Instead you should click the Debug button at the top of the test runner's web page to open a new detached browser tab for debugging, which doesn't report the results back to the runner.
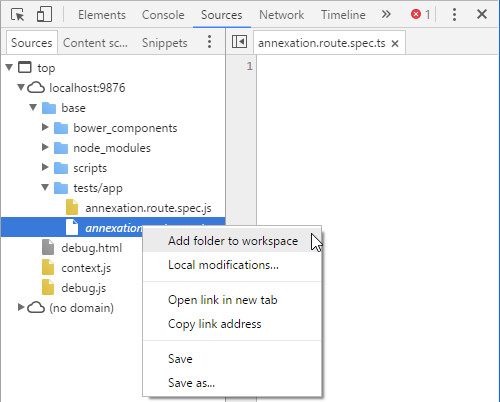
In this new tab, open the Developer Tools. If you're transpiling your JavaScript code, as I am from TypeScript, you should first setup the source mapping by opening the Sources tab and selecting Add folder to workspace from the Sources treeview context menu. For this to work, you will need to have Karma configured to create source maps, as explained in my previous blog post.
Select the root folder with original sources and allow access to it in the banner that pops up. Now right click one of the empty source mapped files in the treeview and select Map to file system resource....
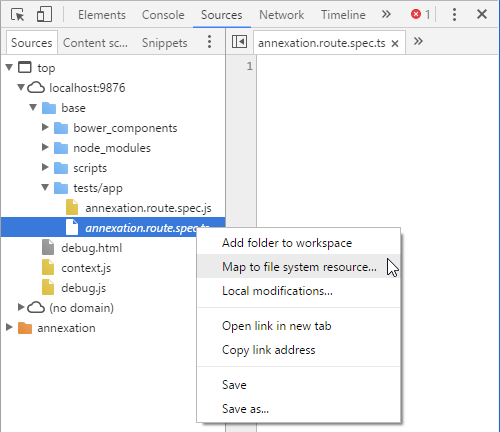
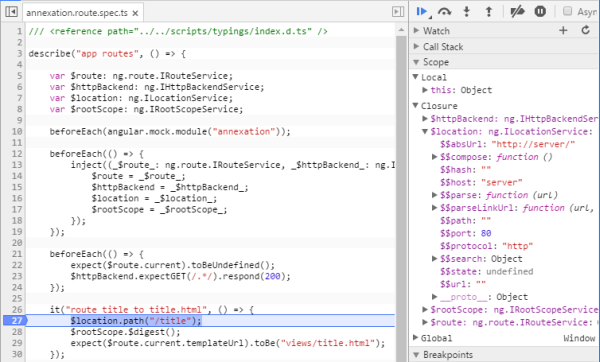
Chrome should only offer you a single matching source file to select. Once you do, all source mapped files should be correctly mapped and you should be able to set breakpoints directly inside the source files in your mapped folder. Do that and refresh the page to run the tests again. The execution will stop at your breakpoints.
You can repeat the process as many times as you want. Once you are done with the debugging session, close its browser tab and proceed with regular development and continuous testing cycle.
