Viewing Console Log from an Android Device
In a previous blogpost, I've described how to intercept console log output when the application is running on the device, so that it can later be exported using the standard sharing functionality. Although this is usually the most convenient approach for testers, it's an overkill during development when the device is connected to the computer most of the time or even the emulator is used instead of an actual device. In such a scenario, it's more effective to look at the console output from the debugger.
Using Visual Studio Code Debugger
I'm doing all my Ionic development in Visual Studio Code, therefore this is my primary tool for debugging and also for inspecting the console log output from the application. For debugging an Ionic application (or any Cordova application) on the device, the Cordova Tools extension is required.
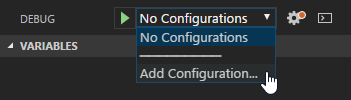
With it, you can add a launch configuration for attaching to the application when running on the device or in the emulator. Open the Debug Side Bar and select Add Configuration... from the configurations dropdown at the top.
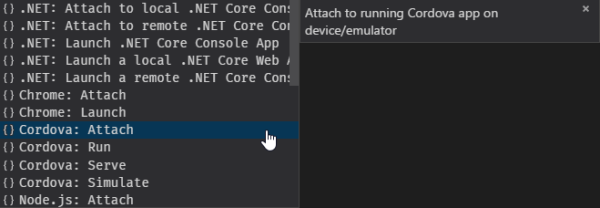
If you don't have a .vscode/launch.json file yet, Cordova options might not be available to you. If that's the case, just select any of the available options (you can remove it later). Once the file is created Cordova: Attach will show up as one of the entries in the pop up inside the editor window.
Select it and fill in the choices for platform and target. The following configuration would be used to attach to an Android device:
{
  "name": "Attach to android on device",
  "type": "cordova",
  "request": "attach",
  "platform": "android",
  "target": "device",
  "cwd": "${workspaceRoot}",
  "sourceMaps": true
}
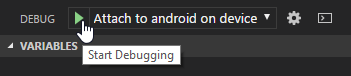
With the Android device connected to your computer and running the application, just start debugging with configuration selected to attach to the application.
Once attached, just open the Debug Console to view in real time everything that's emitted using console.log() inside the application. You'll also see any messages that were logged from the application before you attached the debugger to it.
Unfortunately, the same is not true for errors. You'll only see them if the debugger was already attached to the application when they were emitted.
Using Chrome Developer Tools
If you don't have Visual Studio Code installed and your preferred editor doesn't have similar support for Android debugging, you can use the Android debugger that's built into Chrome.
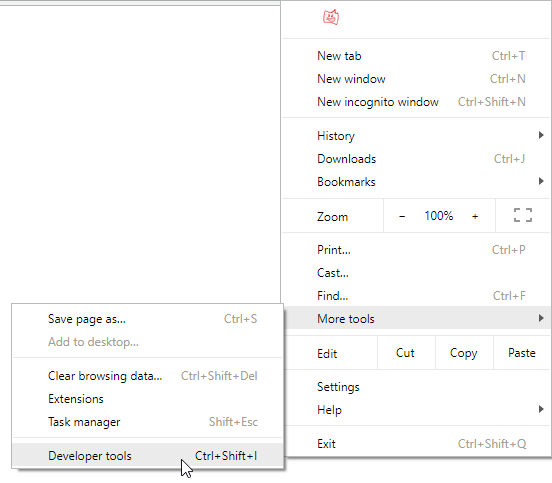
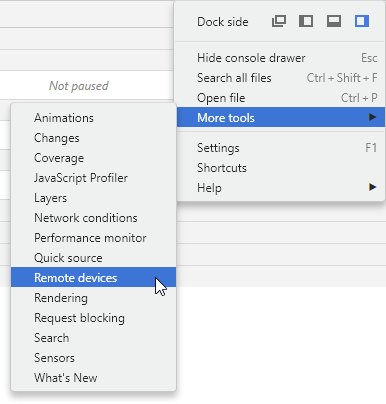
To access it, open the Chrome Developer tools from the More tools menu.
Inside it you need to open the Remote devices view from the More tools menu.
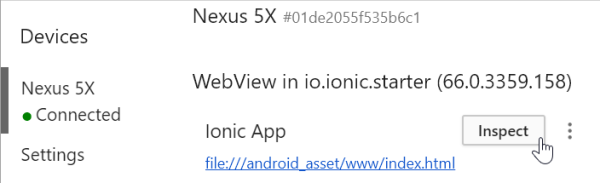
The view will list all attached Android devices and running emulator instances, each with its own list of active web views. By clicking Inspect you can attach to any one of them.
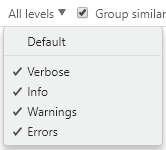
You can view the console log output from the Console view. Unlike Visual Studio Code, it will contain both the log messages and errors which were emitted already before attaching to the application. Just make sure that the output is not filtered by the log level dropdown.
Using Logcat in Android Studio
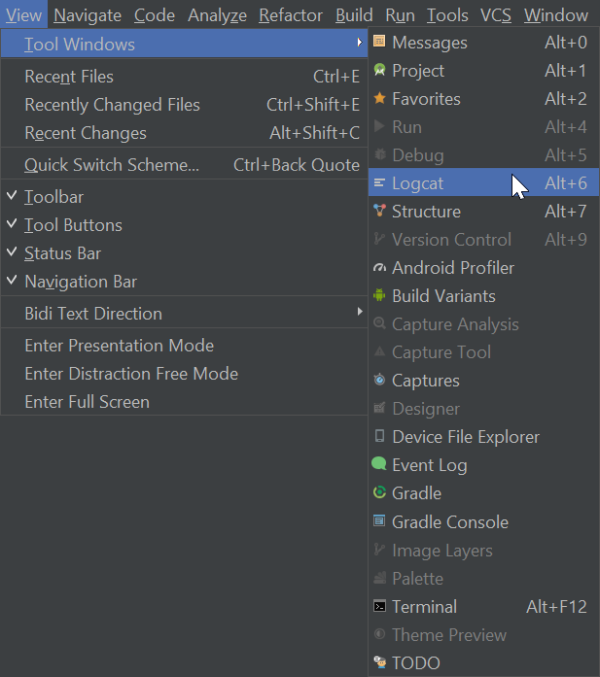
Both approaches so far will only work with development builds. Attaching a debugger to a release build will not be possible. However, all the console log output is still emitted to Android's system log by the web view. To view it, you can use the Logcat tool integrated in Android Studio.
If you have more than one device attached, you can select the right one from the dropdown on the left. Set the text filter to chromium and remove all other filters to see all the output from the web view.

You'll only see console log outputs (even from before connecting the device), but no error outputs. To see those, you'll need to handle them in a global error handler and emit them as console log output.
