OpenTelemetry collection in Rider
When JetBrains announced the availability of an OpenTelemetry plugin for Rider, I decided to give it a try. I've examined the options for OpenTelemetry collection during development in the past and was curious how the new offering from JetBrains will compare.
The plugin requires an early access version of Rider to work, at least 2025.2 EAP8 to be exact. Fortunately, it can be installed side-by-side with the latest non-preview version of the product which you can continue using for regular work.
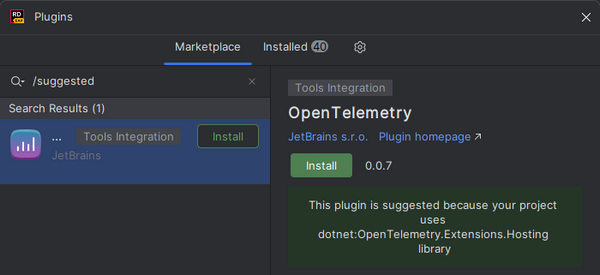
As soon as you open a project configured for OpenTelemetry in this early access version of Rider, it will recommend installing the OpenTelemetry plugin. You won't even have to search for it.
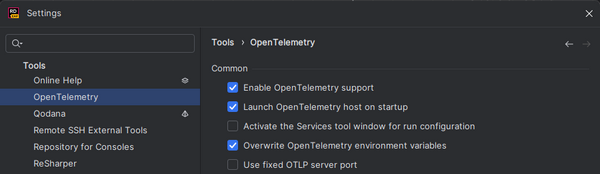
When you run such a project from within Rider with the OpenTelemetry plugin installed, it will automatically take over the collection of OpenTelemetry data. There's no need to configure anything. The plugin will set the OTEL_EXPORTER_OTLP_ENDPOINT environment variable to the URL of its collector, overriding any other configuration. It's a nice convenience, but it also means that the OpenTelemetry data won't be sent to any other collector you might have configured. You can disable this behavior in the plugin configuration by unchecking the overwrite OpenTelemetery environment variables checkbox.
You can access the collected OpenTelemetry data in the Services tool window. Under the OpenTelemetry node there should be a node for your project, and under it one for each instance you start. A click on the instance gives you access to the collected logs with rudimentary filtering functionality. A click on a log entry will show you its details. There's a button in the toolbar which should navigate you to the code that emitted the log entry, but it was always disabled for me.
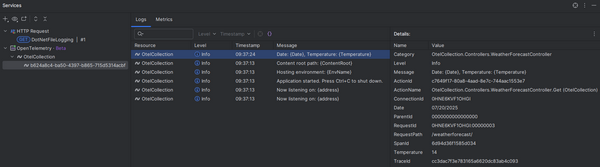
There's a separate tab with access to the collected metrics. I couldn't find a way to view traces.
If you check the Allow automatic instrumentation checkbox in the plugin settings, the plugin should also work for projects which aren't yet configured for OpenTelemetry, but I couldn't get that to work. So if you want to try the plugin yourself but don't have an OpenTelemetry-enabled project at hand, you can use the sample project from my GitHub repository.
The OpenTelemetry plugin for Rider is trivially simple to use. Even more so than the Grafana Docker container I wrote about in a previous blog post. Unfortunately, it's not there yet feature-wise. However, the plugin is still early in its development, and the currently broken and missing functionalities are likely to still be added. Along with support for other JetBrains tools, so that it can be used with non-.NET projects as well.
